These charts and numbers are intended to provide a glimpse into highlights of the SFC’s work in regulation and development. They are also a reflection of market activities. Except noted otherwise, these represent cumulative figures for the reporting years.
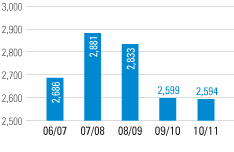
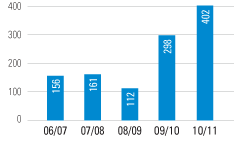
Number of collective investment schemes authorized
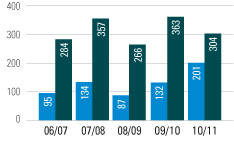
Licensing
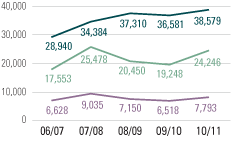
- Applications for SFC licences received
- Applications to conduct new regulated activity received
- Total number of SFC licensees1
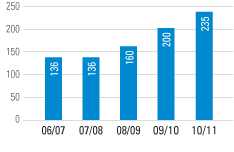
Number of risk-based,
on-site inspections conducted
Prosecutions
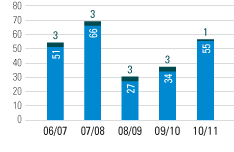

Successful

Unsuccessful
Enforcement case handled
Market-related transactions
- Listing applications reviewed under the dual filing regime
- Takeovers and share repurchases transactions handled
1 This represents a snapshot view as at each financial year-end.
