These charts and tables are intended to show at a glance some top-line measurable aspects of our activities, which, in turn, are a reflection of the market. Except noted otherwise, the figures are cumulative for each reporting year and compared over a five-year period. For a breakdown of some of these top-line items, please see tables in Breakdown of SFC Activity Data.
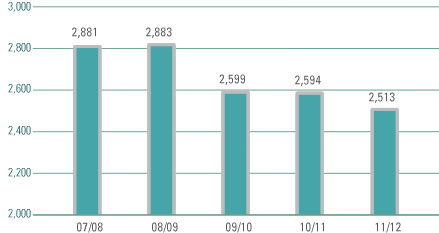
Number of collective investment schemes authorized
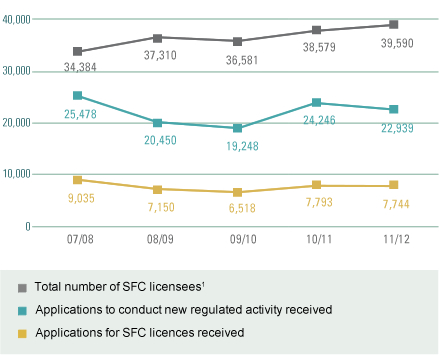
Licensing1
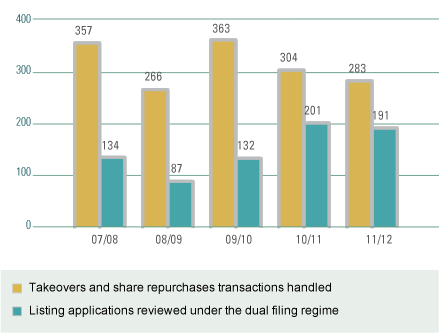
Market-related transactions
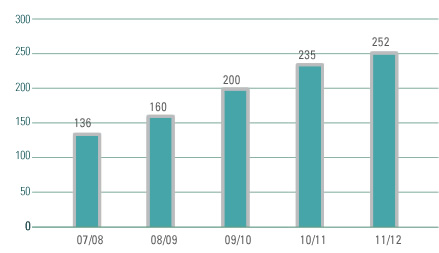
Number of risk-based, on-site inspections conducted
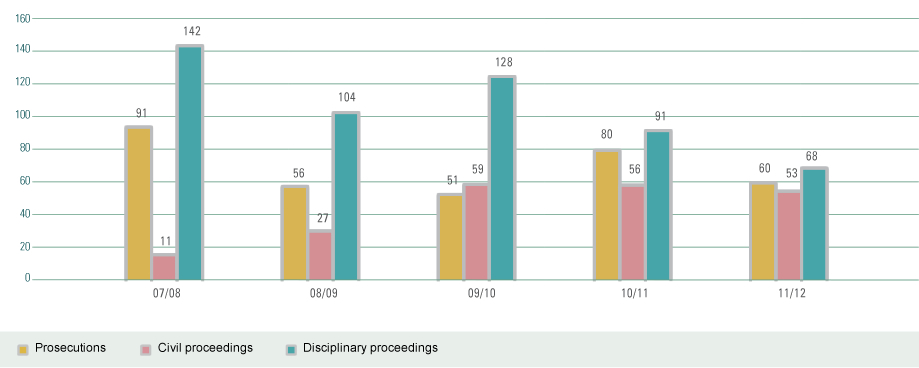
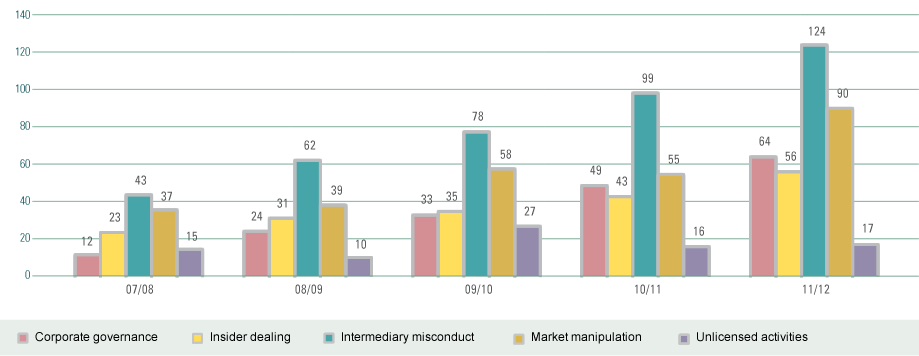
Investigations by nature
Number of persons subject to enforcement action